Uphill or Downhill?
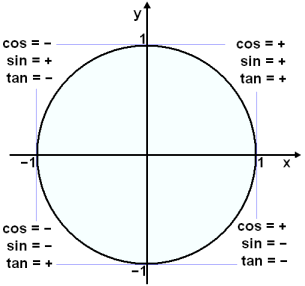
In the image above we see the different quadrants and which ratios are positive in each quadrant and which ones are negative. When we look at tangent and cotangent (since they are the inverse of one another) we see that they are positive in the same quadrants and negative in the same quadrant. The only difference they will see when we begin to graph them is the asymptotes (the areas where they encounter an undefined ratio). This difference changes the shape of the graph slightly. The asymptotes will dominate and be the reason they take a
different direction.
This photo shows the different quadrants on the graph though. We see quadrant one as red, two as green, three as orange, and fourth as blue. The red is positive (+,+), the green is negative (-,+), the orange is positive (-,-), and the blue is negative (+,-). This is for the tangent and cotangent graph though. Other graphs and ratios have other variations. Tangent
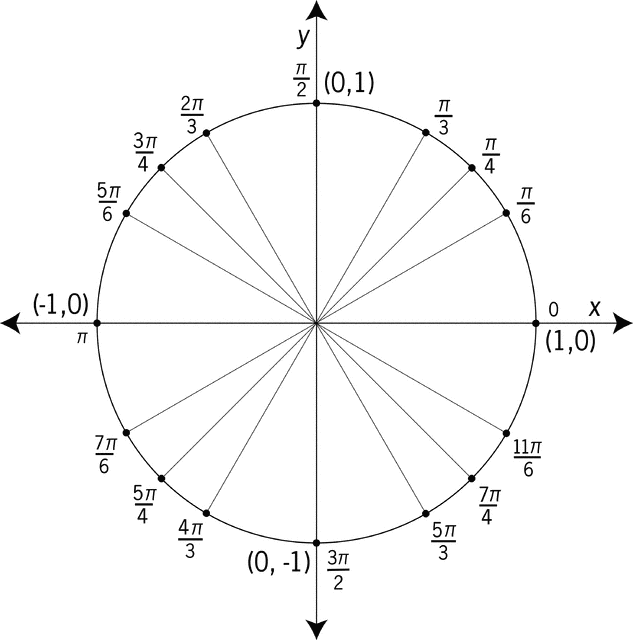
When we look at the tangent graph we have to remember that the ratio. That the ratio for a tangent is sine over cosine. That means that whenever cosine (x) is zero, there will be an undefined term. This results in an asymptote. That means that in one period there will be two asymptotes that will need to be avoided. Those are at pi/2 and 3pi/2. (Look at the image below)
.png)
Then we start to place the graph. We know that tangent cannot touch the asymptote at pi/2 and must be above the x-axis in the red rectangle so that means that we make the curve from the zero up and towards the asymptote. That is because pi/2 is the ratio of 1/0 (90 degrees) and that is an undefined term. (Below)
(https://www.desmos.com/calculator/cwdr1eyszr)
After that we move past the asymptote and go to the second quadrant (the green) which is below the x-axis (negative). This piece of the graph cannot touch the spot of pi/2 because that is an asymptote, but it can cross though pi so it will start near the asymptote and cross the x-axis at pi and turn into a positive in the orange section (the third quadrant). The reason pi is not an asymptote is because sine is 0 and cosine is -1 which makes it a zero.
(https://www.desmos.com/calculator/cwdr1eyszr)
As it turns up into the third quadrant it becomes positive. It must avoid the asymptote at 3pi/2 because that is another undefined term (-1/0) and that means it can get close, but never touch it. That is why the graph goes up. It is positive and near the asymptote.
(https://www.desmos.com/calculator/cwdr1eyszr)
Finally the fourth quadrant (the blue) is negative so the graph has to start down below the x-axis again. It must avoid the asymptote at 3pi/2, but because 2pi is not an undefined term (0/1) it can be crossed through so the graph will turn in the upwards direction once hitting that spot.
(https://www.desmos.com/calculator/cwdr1eyszr)
Overall when we are looking at the tangent graph and the asymptotes that are created by the unit circle and knowing that the quadrants dictate the location that the graph has to have we can see why the graph for a tangent graph is uphill. The graph starts at positive and goes negative to positive again, but because the asymptotes exist at the pi/2 and 3pi/2 (where cosine is zero) the graph has to adjust direction to make it work. The middle two sections is one period. The connected halves starting at the bottom and going positive, lying between two asymptotes is the clearest picture of the real reason the graph goes up. The graph cannot touch either asymptote and has to cross at pi, but remain in the proper areas making it go in the uphill direction.
Cotangent
When we are looking at cotangent we have to remember that the ratio has changed, not the quadrant areas, but the ratios (cosine/sine). This change means that the asymptotes has also changed. When the asymptotes change, the direction of the graph must change to make sure that everything works as it is supposed to. So the colors and the labels for the graph remain the same as the tangent graph, but now it has three asymptotes. These undefined areas are at 0, pi, and 2pi (locations on the unit circle where y is equal to zero making the ratio 1/0 or -1/0).
(https://www.desmos.com/calculator/cwdr1eyszr)
Then we begin to graph. The first asymptote is at zero and the first quadrant is positive. That means that it must not cross the zero mark on the graph. That means it must start up and go through the x-axis in a downwards direction. It will cross the x-axis at pi/2 and then cross into the green as a negative. This means it will have to go down.
(https://www.desmos.com/calculator/cwdr1eyszr)
As it goes into the green it turns negative and must avoid the next asymptote at pi. This is again because the ratio is an undefined term (-1/0 deemed by the unit circle). The graph goes through pi and turns negative and does not touch the asymptote at pi. It makes the graph look like a downhill graph.
(https://www.desmos.com/calculator/cwdr1eyszr)
The third part of the graph must be positive again in the orange quadrant because the ratio is two negatives. It must also avoid the asymptote at pi so it starts in the positive region at the turns down at the 3pi/2. That point on the x-axis is where the graph turns negative again. It flips and then attempts to avoid the third asymptote in the first period.
(https://www.desmos.com/calculator/cwdr1eyszr)
For the final area of the graph we see that it is negative again (the ratio makes this) and it cannot touch 2pi (the undefined). It makes the two periods of the tangent graph. It is the final point in the two cycles.
(https://www.desmos.com/calculator/cwdr1eyszr)As an overall idea, the cotangent graph goes downhill because it is avoiding the asymptotes that are created and stay within the positive and negative areas of the graph. It is different than the tangent graph because the asymptotes are different due to the differed ratios.
References
Mrs. Kirch on https://www.desmos.com/calculator/cwdr1eyszr
http://www.pinkmonkey.com/studyguides/subjects/calc/chap1/c0101601.asp
.png)


.png)
.png)
.png)
.png)
.png)
.png)
.png)

.png)

.png)
.png)
.png)
.png)
.png)

.png)
.png)


