  |
| (http://etc.usf.edu/clipart/43200/43204/unit-circle12_43204_md.gif http://www.rasmus.is/uk/t/F/Su36k02_m06.gif)
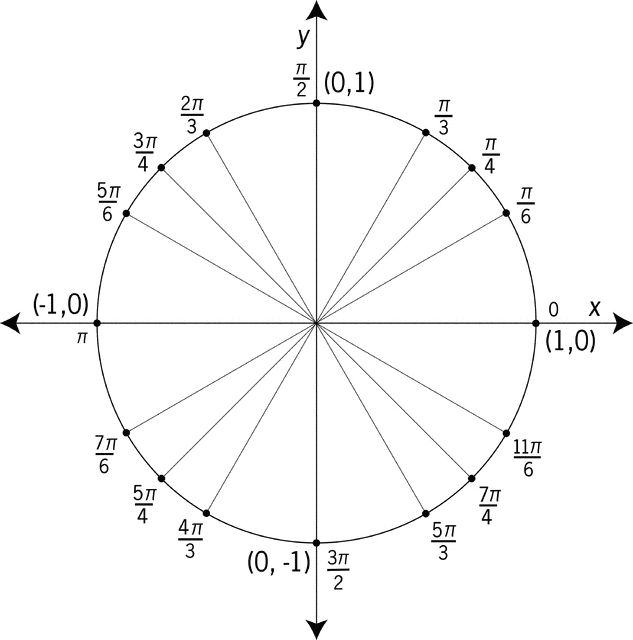
This is an image of the unit circle in radians since when we graph sine, cosine, tangent, and cotangent it is easier to graph them in radians than in degrees. It is more of a challenge to see the graph on the calculator when we use degrees. That is why the radians are used. Now we go on to explain why the periods for the different graphs are the way they are. In reality they all correspond to the unit circle.
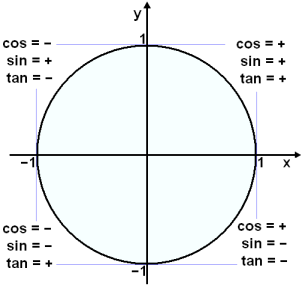
The second image is a picture of the positive and negative ratios in each quadrant. This will also help understand the graphs.
Sine
When we look at the unit circle for sine we see that it goes positive in the first quadrant, positive in the second quadrant, negative in the third quadrant, and negative in the fourth quadrant. Now if we take the unit circle and stretch it out on a graph we see that it works like this.
With this graph it is positive in the first quadrant (0-pi/2) and then also positive in the second quadrant (pi/2-pi). Then it drops below the x axis and becomes negative in quadrant three (pi-3pi/2) and quadrant four (3pi/2-2pi). This is known as a pattern and will continue on forever in both directions. This repetition makes it cyclical. The period is the amount of time it takes for it to get through one cycle on the graph. That means that the period for the sine graph is 2pi. This is because when before we repeat the pattern of positive positive negative negative we go through the whole unit circle which is two pi. That means we will continually see the start of a new cycle after every two pi. They cover 2pi on the graph before restarting basically. This all happens due to the y values on the unit circle.
Cosine
When we are looking at cosine it goes positive in the first quadrant, negative in the second quadrant, negative in the third quadrant, positive in the fourth quadrant on the unit circle. When we stretch the unit circle out we get this on our graph also.

As we look at the graph we see that it matches the unit circle. It is positive in the first quadrant (1-pi/2), negative in the second (pi/2-pi), negative in the third quadrant (pi-3pi/2) and positive in the fourth quadrant (3pi/2-2pi). That shows the unit circle on a graph. It matches the x values on the unit circle. The unit circle dictates it. The period for this cyclical graph is also 2pi. That is because it takes that long to get to a repetition. Then the cycles can start again. They always match the circle and the graph. This will go on continuously forever.
The graph below shows sine and cosine overlapping on the same graph to just give visuals.
Tangent/Cotangent
When we look at the unit circle we see that the first quadrant is positive, the second negative, the third positive, and the fourth negative on the unit circle. If you do this to the graph you will see that this is the same thing.
This graph shows the quadrants on the graph along with the asymptotes. The asymptotes are at pi/2 and at 3pi/2. When we look at the graph we see that it is positive (0- little before pi/2), then negative (little after pi/2-pi), then positive (pi-little before 3pi/2), and negative (little after 3pi/2-2pi). They do not touch pi/2 or 3pi/2 because those are asymptotes and cannot be touched. The asymptote is there because the value is undefined. The reason that the period is only pi for this one is because it takes one pi to start a repetition of the cycle. It is all that simple.
Amplitude
The reason that sine and cosine have an amplitude is because they are the only ones with restrictions. This is because the ratio is y/r and x/r so they can only be as far as the one on the parent graphs. They can only reach the 1 on the top and the -1 on the bottom. The other ratios have no amplitudes because they have no restrictions. It is as easy as that.
References http://etc.usf.edu/clipart/43200/43204/unit-circle12_43204_md.gif http://www.rasmus.is/uk/t/F/Su36k02_m06.gif |

No comments:
Post a Comment